Dashboards#
Dashboards are already present when you install GLPI:
- Central: displays overall information (represents number of PCs, telephones, monitors, etc., number of users and groups, number of tickets, problems, changes, etc.)
- Assets: shows the elements of the portfolio with computer-type graphics by status, by manufacturer. Computers by type, network hardware by manufacturer, and more.
- Assistance: lists tickets and their status. Graphs are available such as tickets by status and month, top ticket categories, number of incoming tickets, assigned tickets, etc.
- GLPI inventory reports: shows the number of agents, tasks, elements in the fleet, etc.
All these tables are of course modifiable.
Creating a new dashboard#
Added new dashboard#
In this example, we will add a global view of the number of tickets and their status as well as an assignment filter by user or group.
- From the main GLPI view (by clicking on the logo at the top left), click on
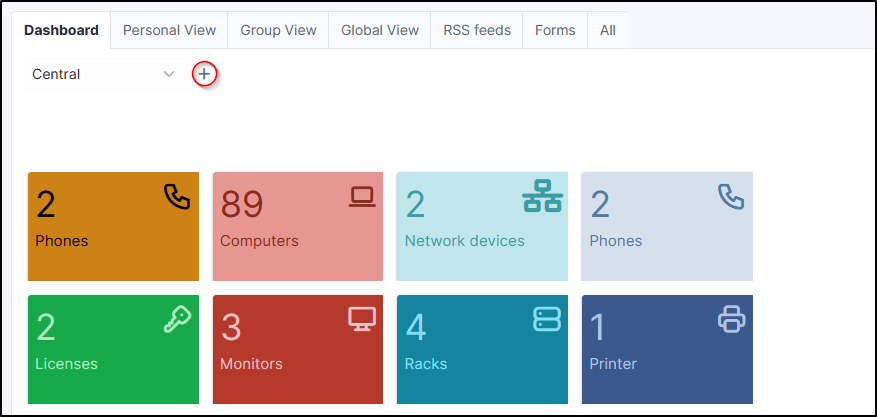
- Enter a name for your dashboard then click on
add - Position your mouse where you want to position your tile and click on
- In the window for selecting the type of data to display, choose the one that suits you (here ticket summary)
- Depending on the data selected, you may be asked to choose the type of chart that will be displayed
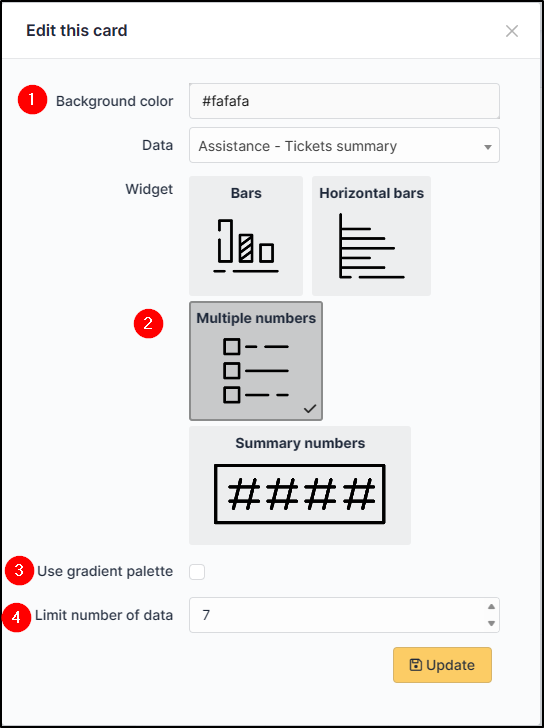
Select the background of your tile
Select chart type
Select the gradient from the palette (shade of gray displayed per tile)
Select the number of data to display (the number of data reflects the number of statuses your tile will display)
- Click on
edit - You can enlarge your tile by selecting and stretching it
You can then add as many tiles as you want.
Add filter#
The filter will display the result of the tile for a given element. In our example, for a particular group.
- Click on
add filter
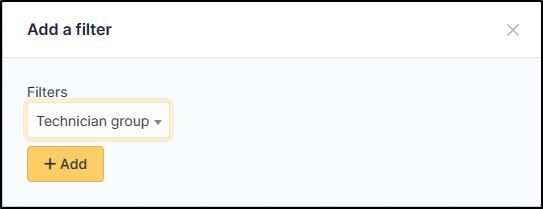
- Select
technician group - Click on
add - When you are satisfied with your dashboard, click on to exit edit mode
If you want to display all the tickets in a group, you can now do so by selecting the desired group from the technician group filter
You can also access the items by clicking on the desired status.
For example, if I want to display all tickets in pending status for group 1, I choose group 1 in the filter and then click on the pending line to display the result in the support tab.
Dashboard options#
In the menu at the top right, you can see a number of possible options:

Refresh data#
allows you to update the data in order to have a result in real time
Clone a dashboard#
allows you to clone a dashboard. It will have the same name with a copy mention. You can of course modify the name of the table and all the data it contains
Share a dashboard#
it is possible to share the dashboard in several ways
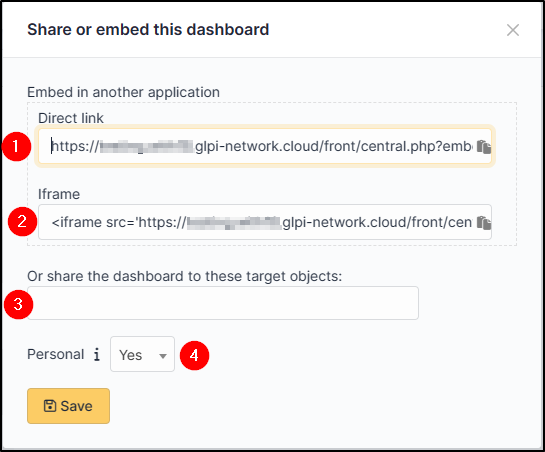
Direct link: this public link can be communicated. It will be accessible without identification and will be displayed in full screen. Only viewing this dashboard will be possible (except if the recipient has a GLPI account on the instance with the necessary authorizations to modify it)
Iframe: allows insertion into a web page
Share with targets: allows sharing with other profiles, entities, users or groups.
Personal: Specify whether this dashboard is private or not. A personal dashboard is not visible to other administrators unless you explicitly share it
Delete a dashboard#
: Delete a dashboard using this icon
Edit a dashboard#
: Allows you to edit the dashboard you are on and modify its elements.
Show full screen#
: Display your table in full screen, this allows for example, to obtain a monitoring screen on elements of your fleet or assistance.